Case Study · Project Detail
Visualizing geographical json data on a USA Map
A D3-powered choropleth of the United States, projecting JSON geodata into an interactive map with tooltips and clean state-level shading.
Year
2023
Status
Completed
Category
Simple Project
Client
Riker Web
Technologies
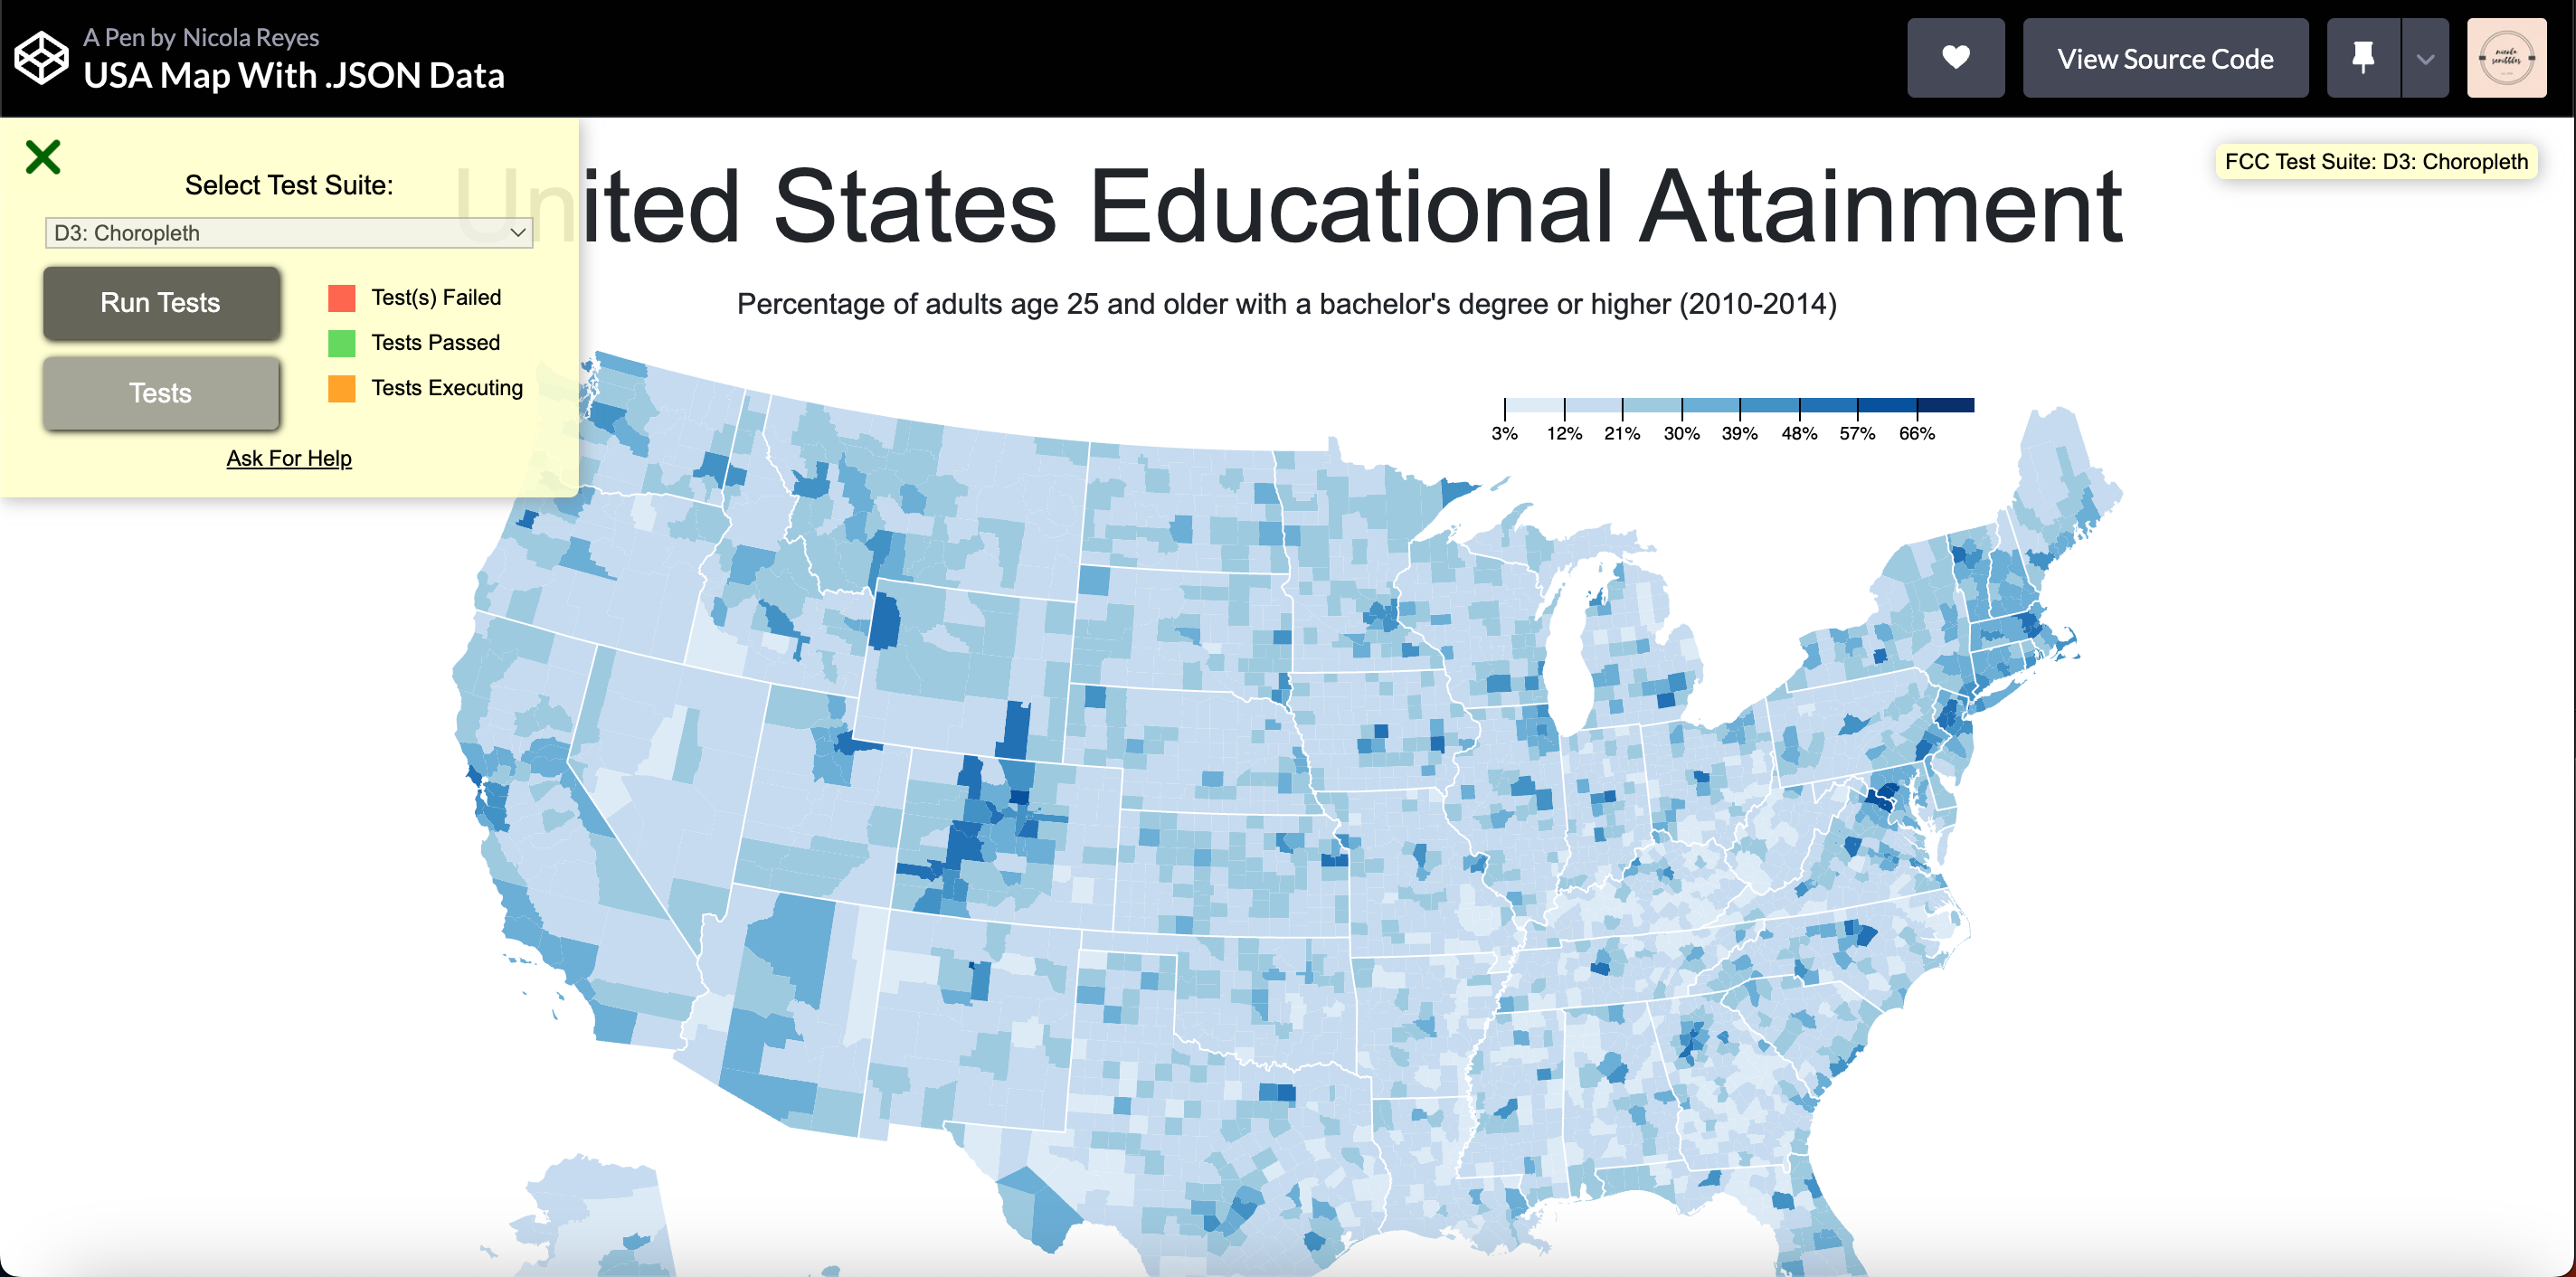
Fig. 01 · Hero Image · Click to enlarge
Case Study · NOTES
Creating a JSON data visualizer with D3.js is an exciting project, and my 'United States Educational Attainment' visualization is a great example of the power of this library. With this visualization, I have created an interactive tool that displays the percentage of adults age 25 and older with a bachelor's degree or higher across the United States.
One of the key benefits of using D3.js for data visualization is its flexibility and versatility. With a wide range of built-in functions and tools, I can easily customize your visualization to fit your needs and preferences. This makes it a great choice for displaying complex data sets like educational attainment across the United States.
Your visualization also demonstrates the importance of data visualization in understanding complex data sets. By representing the data in a visual form, you make it easier for users to understand and analyze the information. This can be especially useful for researchers, policymakers, and educators who are interested in understanding educational trends and patterns across the country.Moreover, this visualization is not only informative, but also visually appealing. The use of color and interactive elements like tooltips and zooming features add to the overall user experience and make it easier for users to engage with the data.In conclusion, my 'United States Educational Attainment' visualization is a great example of the power and flexibility of D3.js for data visualization.